Introduction
Bottom water (BW) is found in numerous McMurray Formation reservoirs throughout the Athabasca region of NE Alberta. BW is defined as a zone below the base of bitumen pay with high water saturation (Sw), and can be in direct or non-direct contact with overlying pay. Figure 1 shows the BW as a dark blue colour fill.
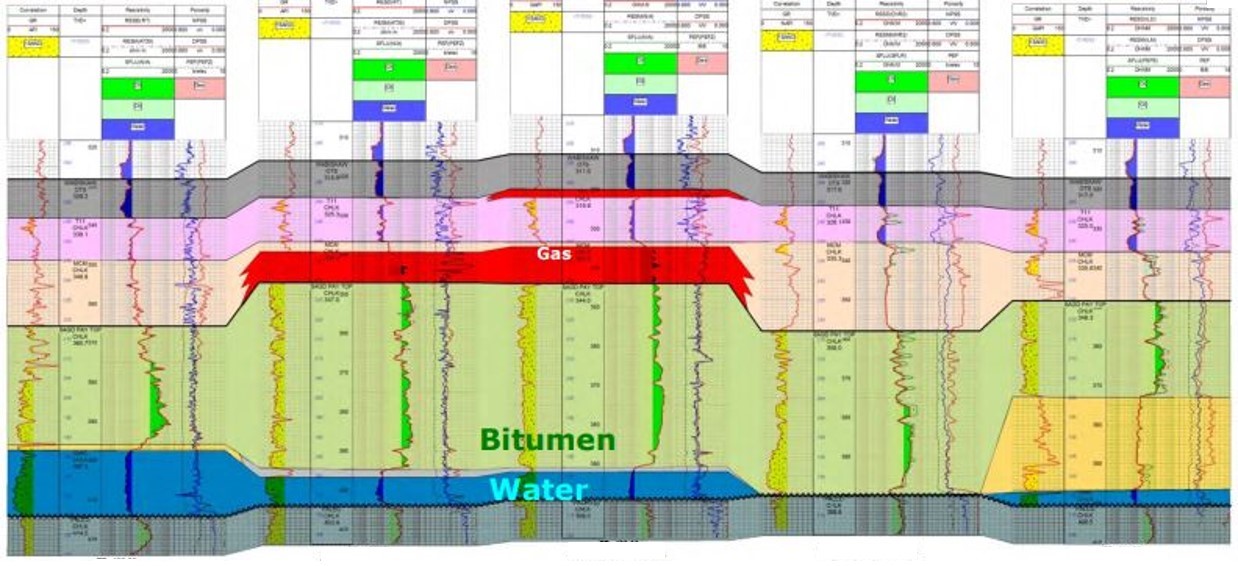
Figure 1 Bottom Water Cross-Section (Source: AER 2016 D54 File 8591)
Established by outcrop and control with vertical oil sands evaluation (OSE) wells, BW can have a variable structure and contact geometry with the high viscosity bitumen. A key technical challenge to placing a steam assisted gravity drainage (SAGD) producer well is understanding the BW elevation relative to the pay zone. 3D seismic can’t resolve a sand-on-sand bitumen/BW contact because of the similar density of bitumen and water. Historically, to mitigate the producer well intersecting the BW, most operators applied a producer well stand-off height of +4m above the bitumen/BW contact.
The opportunity associated with this technical challenge is to minimize the stand-off height while achieving the operational conditions required for the daily production of these SAGD wells. Reducing the stand-off height by 0.5m adds incremental reserves and can improve economics for a SAGD pad, dependent on reservoir quality and BW structure.
The data and figures used in this article are sourced from the Alberta Energy Regulator’s Directive 054 In-Situ Performance (D54) presentation site, except where noted. The opinions shared are from my first-hand experience working on six different SAGD assets and over 110 SAGD well pairs. My opinions don’t necessarily represent those of my former employers.
Background
Throughout the history of SAGD well placement, resistivity-based logging while drilling (LWD) technology has evolved. Never the less, a persistent challenge of LWD technology is the inability to look ahead of the drill bit. The depth of investigation (DOI) of today’s ultra-deep LWD (UDLWD) has dramatically improved, and is now capable of up to 30m DOI, depending on reservoir conditions. While this scale of DOI is impressive and is significant to understanding the reservoir architecture, limitations remain during the drilling process because of the tool’s relative position to the drill bit in the bottom hole assembly (BHA). Dependent on the service provider, and the UDLWD tool configuration used, the tool could be as much as 30m behind the drill bit. This position of the UDLWD tool in the BHA, combined with the unpredictable nature of the bitumen/BW contact could still result in a production well intersecting the BW.
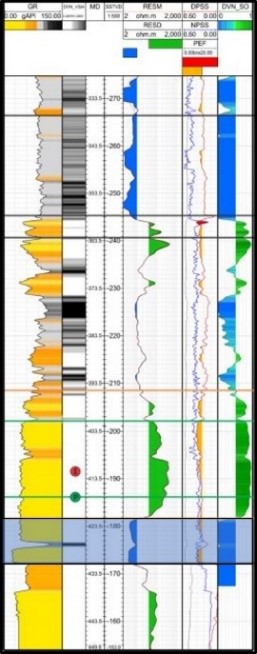
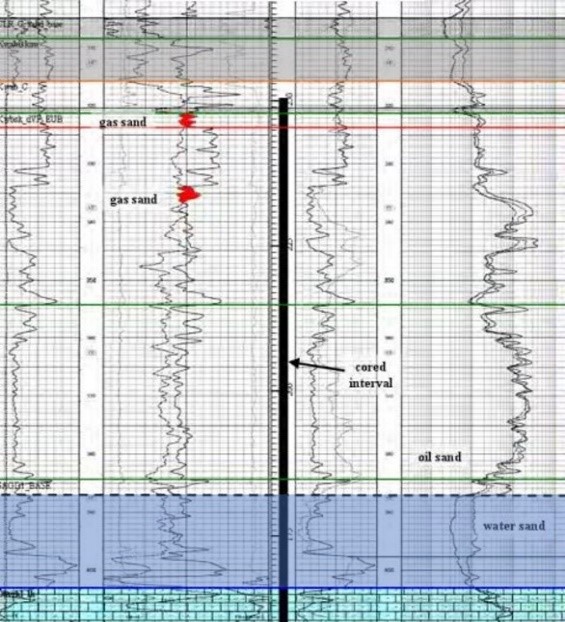
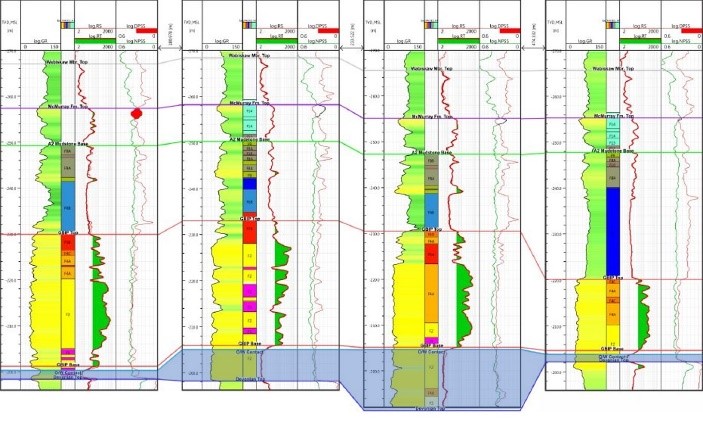
Figure 2 shows a BW (dark blue colour fill) wireline log example identified by the resistivity log’s low reading, third column from the right. Note the sand-on-sand contact at the bitumen/BW contact. Figure 3 shows another BW log example (dark blue colour fill) from a different operator. The resistivity log is in the first column from the right. This ability to identify BW using geophysical wireline logs aids in confirming the attributes and elevation of the BW at a specific location.
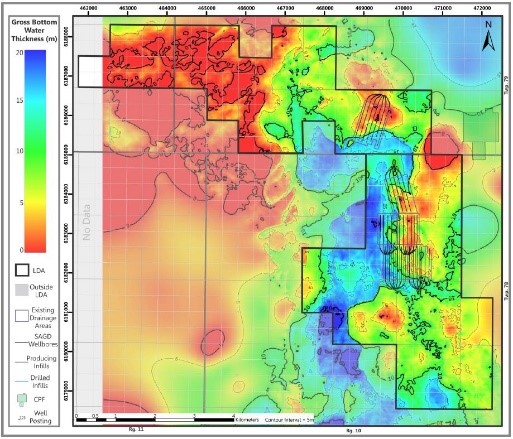
By combining the OSE well wireline log picks with a Pre-Cretaceous unconformity structure map derived from 3D seismic, large-scale BW trends can be derived, see Figure 4. The cold colours (blues) represent thick BW and are correlatable to Pre-Cretaceous unconformity structural lows. But, at the scale required to confidently plan and drill a SAGD producer well path, the elevation of the BW surface between the well control would be uncertain, see Figure 5.
This uncertainty can manifest as unpredictable and rapid changes in the BW elevation and characteristics, see Figure 6.
Alternative Trajectory Design and Execution Process
To mitigate uncertainty of the BW elevation during drilling an innovative use of the UDLWD tool combined with a horizontal pilot hole is a solution that can be considered. This solution was tested during drilling of the 2016 Statoil Canada Ltd. Leismer Pad L5 infill well program using the Baker Hughes Visitrak UDLWD tool (Source: Vetsak, A. et al, 2017). Since this initial test in 2016, the process of using a horizontal pilot hole coupled with an UDLWD tool has evolved.
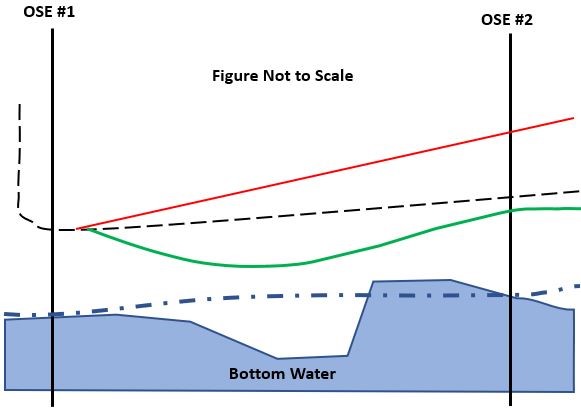
Using the OSE well control along and offsetting the well path and by incorporating 3D seismic, a preliminary elevation surface of the BW top of structure (blue dashed line) is estimated, see Figure 7. This preliminary BW surface is used to plan the pilot hole trajectory (red line) and to plan the preliminary trajectory for the producer well (dashed black line). The horizontal pilot hole and the lateral section of the producer use the same surface hole, build section and intermediate casing point. The pilot hole and producer are drilled using the same BHA. The pilot hole is drilled using a simple flat trajectory at an elevation estimated to be between the producer and injector.
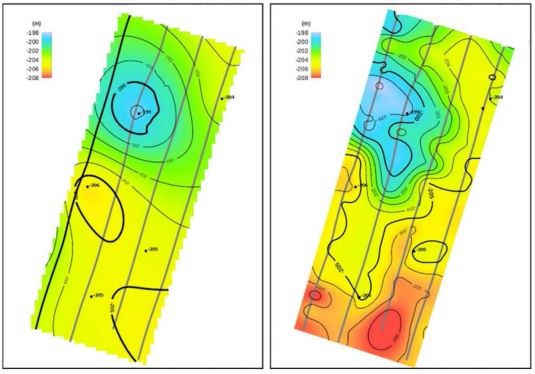
The UDLWD resistivity and LWD gamma ray data from the pilot hole, combined with the OSE well control data is then be used to develop a revised elevation surface of the BW top. Figure 8 is an example from Leismer Pad L5 and demonstrates the structural surface details that can be gained from use of the pilot hole’s UDLWD data, (right-hand image). Note the structural high region (warm colours) missed by using only the OSE well log data. This revised top of BW surface (blue colour fill polygon) is used to finalize the producer lateral trajectory (green solid line), see Figure 7. The added information can be used to reposition the planned drill path of the producer well to minimize stand-off height, to understand and avoid reservoir complexities and to ultimately better operate the producer.
Including the UDLWD data and the revised BW surface in planning and during drilling, will minimize geological uncertainty and increase drilling efficiency of the lateral section in the SAGD producer well.
Because of the UDLWD’s potential 30m DOI, the resistivity data could provide reservoir characteristic insight associated with the upper portion of the reservoir, above the injector, and possibly the top of pay. This information could be used during the operation of the well pair and would be useful to plan future well interventions, e.g. placement of tubing deployed flow control devices, steam splitters or bridge plugs.
In conclusion, this article used BW uncertainty as inspiration for an alternative well placement process, design and execution. A similar alternative pilot well process could be used for solving other reservoir related well placement challenges, such as complex reservoir geometry, heterogeneous reservoir quality at or near the base of pay, and variable fluid saturation (lean zones) within the reservoir.
References
Fustic, M., Bennett, B., Huang, H., Larter, S. R. 2012. Differential entrapment of charged oil – New insights on McMurray Formation oil trapping mechanism. Marine and Petroleum Geology 36 (2012), pages 50 – 69.
Vetsak, A., Jablonski, B., Theunissen, I. 2017. Increased Exposure Oil Reserves by Optimizing Wellbore Placement with Extra-Deep Azimuthal Resistivity LWD Service. EAGE Horizontal Wells 2017, Kazan, Russia, May 15 – 19.
Vetsak, A., Jablonski, B. 2018. Increased Exposed Bitumen Reserves by Optimizing Wellbore Placement in Oil Sands with Extra-Deep Azimuthal Resistivity LWD Service.
 Mark Savage, P.L. Geo., has been in the oilsands business for over 18 years. Mark started his oilsands career with Petro-Canada working on the Lewis, MacKay River and Fort Hills projects. Since leaving Petro-Canada in 2008 he has been actively engaged in various oilsands assets with Ivanhoe Energy Ltd., Statoil Canada Ltd. and Athabasca Oil Corporation. He has collaborated on and lead in-situ operations and development projects.