
Introduction
Steam Assisted Gravity Drainage (SAGD) is a complex process which requires more control relative to conventional applications during the production operations. Control of the production profile along the wellbore and prevention of hot spots are essential in improving the drainage efficiency. Over a decade ago the first Flow Control Device (FCD) completions were installed in SAGD wells in Canada with the intention of improving the steam chamber conformance and reducing the steam-oil ratio. The first installations were Liner Deployed (LD) FCDs. Based on the success of LD FCDs, operators progressed to retrofitting with Tubing Deployed (TD) FCDs in underperforming SAGD producers, primarily completed with slotted liners. While the majority of the wells retrofitted with TD FCDs have shown better performance, well failures have been reported and in some cases performance of wells with TD FCDs were below expectations. Hence the question of what’s the cause for this discrepancy with the number of perceived underperforming TD FCDs compared to the LD FCDs.
Liner Deployed vs. Tubing Deployed
While the equipment required for both TD FCD completions (Figure 1) and LD FCD completions (Figure 2) are the same, the configuration of the completion and the operating point of the devices performance envelope are quite different. These differences are due to two key factors, the time of implementation in the wells life and the existence of an annular gap. LD FCD completions are installed prior to the initial production phase of the well, allowing them to exert a rate dependent pressure drop ensuring a good development of the steam chamber. In the case of TD FCDs, the completions are installed after a period of time post initial production; the development of the steam chamber has already initiated, perhaps with an uneven conformance. Hence the TD FCDs are used as a corrective measure (reactive) whereas the LD FCD are used as preventative measure (proactive).
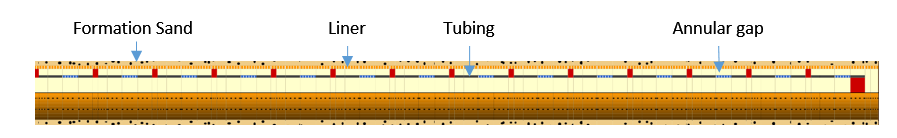

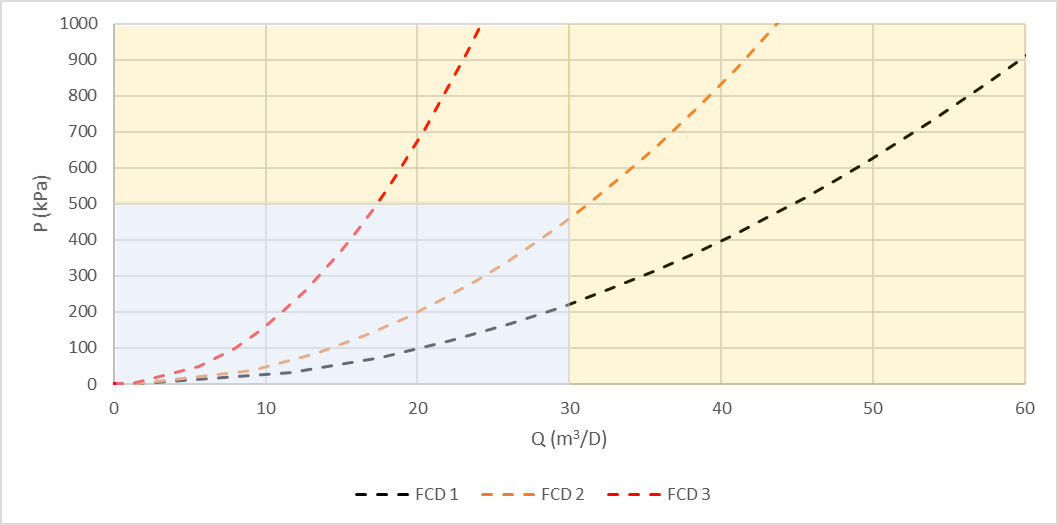
For LD FCD completions it is believed that the formation sand will be retained by the sand control media (i.e. screens, slotted liners, etc.) and hence the gap between the open-hole and sand control media will be packed, so once the operation starts radial flow will be dominate the process. Based on this consideration for optimum productivity, screen contact is of paramount importance especially in lower quality sands; this results in the requirement of a larger number of FCDs. In the case of TD FCD the hole stability is provided mechanically by the liner (i.e. with either screens or slots), ensuring that an annular gap exists between the liner and the tubing containing the FCDs. This results in fewer FCDs being required. Therefore, TD FCDs are generally associated with higher fluid production rates per joint of FCD compared to the LD FCDs. Figure 3, shows the performance of three devices offering varying degrees of resistance; the section highlighted in blue is a general operation window for LD FCDs. While TD FCD wells may also operate in this blue section, there are a number of the TD FCDs that will operate outside of it.
The existence of the annular gap, as in the case of TD FCDs, heightens concerns of erosion. If the liner sand control media is not sized correctly or is in poor condition then alternative approaches to FCDs may be required.
Objective of FCDs
The main objective of the TD FCDs is to improve steam chamber conformance by controlling the production flux profile and choking back the unwanted fluid phase. Unlike conventional applications, where mobility and flow performance of the oil phase is only varied by position on its relative permeability curve, in thermal applications the temperature determines mobility of the oil. Hence the production flux profile along the well is a function of the temperature profile. In hotter well segments the oil will have higher mobility while in colder segments the oil will have lower mobility, and in some cases, oil may have no mobility as the temperature is too low (less than 80°C).
Therefore, improving steam chamber conformance is an important objective that can lead to increased productivity. Figure 4, shows the Inflow Performance Relationship (IPR) for a SAGD well (orange curve) that has been matched to actual production data. This model is based on the temperature profile pre-installation of the TD FCDs. The temperature profile had hot and cold sections. By implementing the FCDs, production from the hotter zones should be choked back leading to higher drawdowns in the cooler less developed segments of the well, and result in improved conformance.
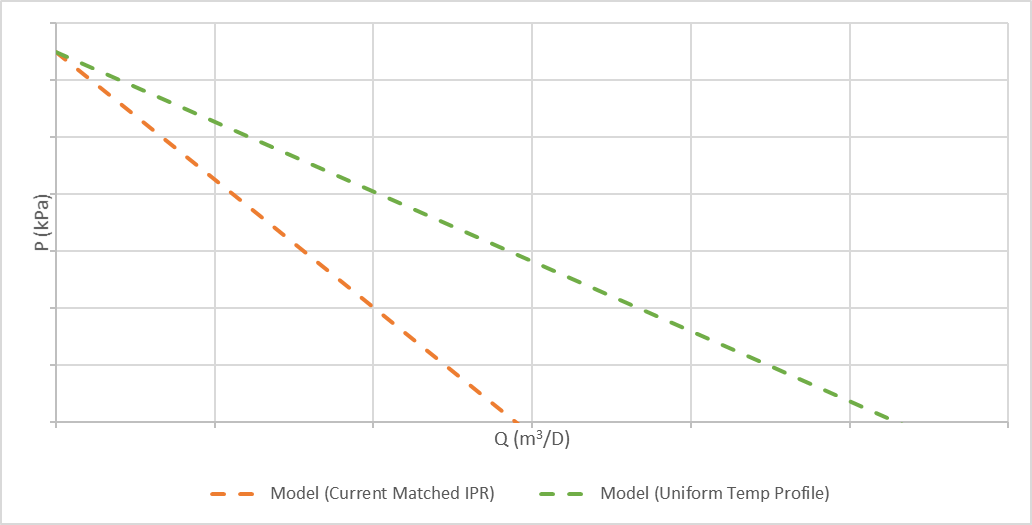
Once the steam chamber conformance is improved the productivity rate of the well should increase, as depicted by the green curve in Figure 4.
Understanding the Pressure Breakdown
Considering that passive FCDs are designed to add a rate dependent pressure drop, it should be expected that the productivity will be altered. However, looking at the performance behavior of an FCD device without consideration of the impact on drawdown could lead to a less effective completion design or to completions that exhibit higher than expected drawdown. This can be explained by an example that is used as proxy, based on analysis of several wells in a field. Figure 5 shows the IPR of the well represented by the dashed black line.
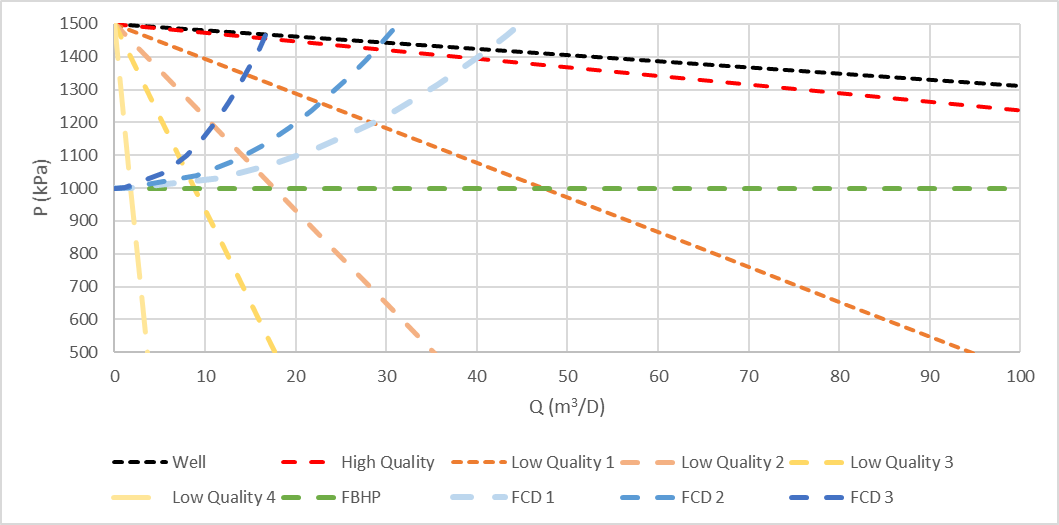
The yellow, darker yellow, light orange, dark orange and red dashed lines describe the IPR for the various segments of the well with different reservoir quality. Red is the higher quality sand segment, while the yellow is the lower quality sand segment. The higher quality sand (red) is the segment that provides the majority of the production. To limit the production in the red segment and promote production from lower quality sand in the yellow segment of the well, FCDs could be utilized. The performance of three FCDs with a varying degree of resistance are shown by the three blue dashed lines; the lighter blue line represents a lower resistance FCD setting while the darker blue line represents the higher resistance setting. Note that at lower rates the difference between the settings is small, however the difference increases with increased production rates. The ‘solution’ point where the IPR curve and the performance of the FCD cross represents the production rate achieved from this segment at the desired flowing bottom-hole pressure in the annulus if the same fluid breakdown is assumed. The pressure difference from the solution point to the reference pressure that originated the FCD device curves (green dotted line) is the pressure drop through the FCD. The reservoir pressure minus the pressure at the solution point is the drawdown upstream of the FCDs. As observed, a single FCD resistance setting can provide the solution for a range of production rates. For example, FCD 2 is able to choke the two higher quality sand segments while promoting higher drawdown in the low quality sands.
Choking back the higher quality sands responsible for the majority of the production pre FCDs, will result in a lower production rate for a given Flowing Bottom Hole Pressure (FBHP); giving the impression at first glance, that the device is exerting a higher pressure drop than expected. The presence of steam, will further exacerbate the pressure drop through the FCDs in that segment and shift FCD performance curves to the left; the performance could be significantly impacted even though the presence of steam may just be associated with a single compartment (usually the hotter/higher quality sands). To achieve the same or a higher liquid production rate as pre FCD, a higher total drawdown than expected will be observed. Hence when evaluating an FCD completion an entire system performance should be taken into account.
TD FCD Key Considerations
The first and most important step is to determine if a well is a good candidate to be retro-fitted with FCDs. While the FCDs have provided value in a lot of cases there are instances where implementation of TD FCDs has exacerbated a problem rather than solving it. Further, if TD FCDs are to be retrofitted in a slotted liner then an analysis should be conducted to ensure that the liner is in good condition (no plugging) or if further remediation is required.
There are three key design elements that have shown better results.
The first design element is the pressure drop through the devices needs to be greater than the pressure drop through the sandface [1] [2]. This design element was established in conventional applications and it is believed to be equally valid in thermal applications [3].
![]()
This will ensure that the FCD exerts the control needed to further enhance productivity in the lower quality segments. The selection of the FCD resistance setting should be made with the objective of controlling the average to higher quality segments. It important to note, that high quality sections may not have been developed yet and could be cold prior to the installation of the FCDs. FCDs would promote the development of cold high quality sections and therefore enough compartmentalized flow resistance needs to be available to control these high quality sections once they are developed.
The second design element is that in thermal applications a constant resistance setting with equal length compartments should be used. This is due to the fact that as the temperature profile changes the deliverability of the sections changes hence constant design approach will ensure that today’s design will perform in the future regardless of the changing conditions. It is important to note that the FCDs are flow rate dependent. Therefore as demonstrated in Figure 6, by having a large enough pressure drop to control the good quality segments, the resistance provided by the FCDs (red) will be less than the drawdown across the formation (blue) in the poor quality segments. In a low production segment the majority of the pressure drop will be from reservoir drawdown rather than FCDs. Note again, that when most of the pre FCD well production is from a single segment, the total pressure drop will be greater than expected based on performance of the FCDs.

The third design element is that with increased reservoir heterogeneity, a higher number of FCD compartments with a higher resistance setting will provide a better control along the wellbore.
Summary
While some failures and performance below expectations have been observed with TD FCDs, there have been many wells retro-fitted with FCDs that have performed well. For a successful implementation of TD FCDs an evaluation should be conducted to determine if the well is a suitable candidate, and to forecast the expected improvement in well performance once ideal steam chamber conformance is achieved. If it is the right candidate a holistic design approach that takes into account the key element of pressure drop as previously explained, should be used to ensure improved performance and minimize well failures. .
Nevertheless, barriers still exist to better understanding of thermal completions and how to optimize them. Optimizing completions requires quantification of the flow profile along a well. In conventional applications, production logging tools are used. In thermal applications, Distributed Acoustic Sensing (DAS) coupled with Distributed Temperature Sensing (DTS) has potential to provide the solution for quantifying and characterizing flow along the well. This would allow engineers to understand and accurately setup models for well performance analysis and design.
References
[1]K. Gohari, H. Jutila, C. Mascagnini, A. Gryaznov, N. Goodwin, M. Howell, P. Kidd and B. Bijani, “Novel Workflow for the Development of a Flow Control Strategy with Consideration of Reservoir Uncertainties,” 2015.
[2]M. Madan, K. Gohari, R. Vicario, H. A. Jutila and H. A. Mohammed, “Milestones, Lessons Learned and Best Practices in the Designing, Deployment and Installation of ICDs in Saudi Arabia,” 2015.
[3]M. Irani, “On Subcool Control in the SAGD Producers. Part II: Localized Hot Spots Effects and Optimization of Flow-Control-Devices,” 2018.
About the Authors

Kousha Gohari is currently the lead of the Optimized Completion Strategies Group at Baker Hughes Canada, a GE Company (BHGE). After obtaining a petroleum engineering degree from the Texas Tech University, Kousha joined Baker Hughes and has held a wide range of positions in completions, reservoir and production engineering. Kousha has extensive experience working in the Gulf of Mexico, the North Sea and the Middle East. He has expertise in flow control devices and completion optimization for reservoir management. Kousha holds a number of patents and is an author of numerous technical papers. Currently, Kousha is serving on the Committee of the SPE Thermal Well Integrity and Design Symposium 2019.

Oscar Becerra Moreno holds mechanical engineering diploma from University of Carabobo, oil and gas specialist diploma from University de Oriente and Master of Science degree in mechanical engineering from University Simon Bolivar (Venezuela). Oscar began his oil and gas career with the Venezuelan National Oil Company (PDVSA) in 1992 as a production engineer and an artificial lift researcher. Since then he has held positions in Petrobras Energia as senior production engineer in Venezuela and Argentina and in PetroChina Canada as a senior production engineer. He has also worked with service companies supporting lower completions, intelligent completions and artificial lift in Latin America, the Middle East and Canada. Currently, Oscar is the Reservoir Optimization Manager for Lower Completions – Global at BHGE.